Dual coding is in vogue. I’m excited by this because the use of diagrams can make an explanation significantly clearer and more memorable. However, I’m also worried, because ideas in education have a tendency to mutate and be misapplied.
In my next few posts, I explain exactly how I teach using diagrams. I will do this through a series of example diagrams. Although they are science examples, each diagram has been carefully selected and categorised to illustrate the principles of dual coding that are applicable to all subjects. I hope this blog series not only helps teachers improve their explanations, but also be critical when dual coding is misapplied.
This post is part of a series titled Clear Teacher Explanations. Part 1 is about teaching abstract concepts using concrete examples and non-examples. Parts 3 and 4 will be about teacher presence in the classroom and effective questioning respectively.
Categories of dual coding
In my mind, the diagrams used in dual coding can fall under two categories: organising visuals and representative visuals. In my next few posts, I will discuss four types organising visuals. Their purpose is to make the hidden structure behind an idea visible to pupils. The first type of organising visual is a process or sequence.
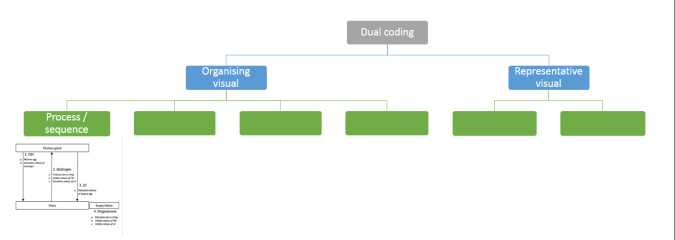
Organising visual 1: process or sequence
Processes or sequences are complex to explain because you are not describing the individual steps alone, but also the relationships between the steps. The relationships might be temporal in nature (firstly, secondly, then); might contain causal relationships (therefore, because, consequently); or may include spatial dimensions (above, below, in the brain, in the ovary). The associated vocabulary demands are high – relying on words alone is problematic for all pupils, but especially EAL pupils, or pupils with low reading ages.
We all know that good public speakers ‘foreground’ or ‘signpost’ what they are saying. They make the structure of their explanation explicit. Why not take this to its logical conclusion and turn the process or sequence into a diagram?
If you do not provide a visual during your explanation and rely solely on your words or the text, then you are depriving your pupils of a framework onto which they can hang facts in an order that makes sense.
Such a visual can be as simple as showing each step of a process in order of cause and effect, like the example below showing the impact of climate change on life:

One of my weakest Y11 pupils last year had learned this diagram off by heart and was able to give such an impressive answer when I asked her ‘What impact does human activity have on biodiversity?’. I could see her imagining this flow chart. Since she had committed it to her long-term memory, she could focus her efforts on explaining the words in between each box of the flow chart, such as ‘causes’ and ‘results in’ etc. This meant her explanation was articulate and coherent, in a way that would have been impossible had I told her to learn the ideas from a list of 12 bullet points or indeed a (lengthy) paragraph.
The hormones of the menstrual cycle are the example where I have seen the power of diagrams like never before. The first time I taught this topic, I remember struggling to explain the interaction of hormones: it was an overwhelmingly complex sequence. After a very confusing lesson, I went away and came up with this:

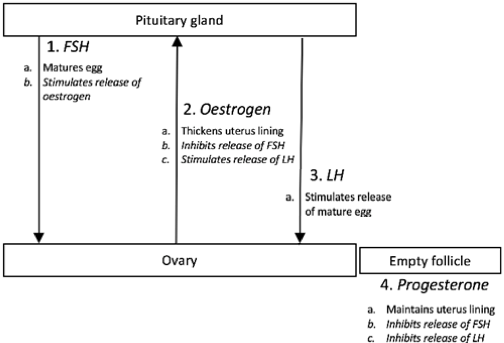
The transformation was remarkable. I went from teaching what was essentially a list of a dozen facts to one neat structure upon which I could hook a few facts at a time, practice, and layer more facts. ‘The menstrual cycle is a dialogue between two glands…’. If you have taught this topic before, I am sure you can appreciate the difference this diagram can make.
How to use in the classroom
- Start your explanation with a diagram of a blank skeleton of the structure of the idea.
This might be like the blank hormones of the menstrual cycle diagram above, or like the boxes of the global warming flow chart but without any text.
- One step at a time, fill in the gaps, and explain each step of the process/cycle explicitly.
- Give your pupils the opportunity to rehearse explaining each step for themselves as you go.
E.g. ‘Tell your your partner, the first three hormones that control the menstrual cycle in order, and which glands release them – 20 seconds… go!’ They can look at the diagram while answering, because importantly, they are practising articulating what the arrows mean; they are rehearsing assigning meaning to the diagram which is acting as an aide memoire. A by product of this sentence-level practice will be that they remember the key words.
- Once a significant chunk has been covered, hide your diagram, and get pupils to practise drawing what you have covered so far on mini whiteboards.
For the hormones, this would be the diagram skeleton with the gland and hormone names, but no information about the roles of hormones at first. Eventually, I get them to do it three more times in the lesson, adding the roles of each hormone successively.
- Writing practice: pick a specific part of the sequence for pupils to construct a sentence with. Depending on the ability of the class, you might expect pupils to do more than one sentence.
In short, the pupils practise filling in missing segments that are omitted from the diagram. Remove increasingly greater chunks. Eventually they can retrieve the whole thing. They are now in a position to develop their sentence and paragraph construction.
Next week, I discuss two more organising visuals: for definitions & for complex ideas.

Pingback: Clear Teacher Explanations 2b: dual coding – definitions & complex ideas | Bunsen Blue
Pingback: Clear Teacher Explanations I: examples & non-examples | Bunsen Blue
Pingback: Venn and the Art of Categorisation – docendo discimus
Pingback: A model for sequencing in Biology – part 2 – A Common Biologist
Pingback: Clear Teacher Explanations 2c: Procedures | Bunsen Blue
Pingback: Clear Teacher Explanations 2d: Faithful Diagrams | Bunsen Blue
Loving this series. Do you know of anywhere where teachers can share these, create a pool of them?
concrete examples/non examples, process diagrams, the rest that I’m sure will be great but haven’t read yet? Be interesting in seeing more examples from across all strands of science, and to share examples myself. I teach to the Irish curriculum, so courses are slightly different, I struggle to see how to do this for extremely abstract concepts like wave-particle duality or the uncertainty principle. How do you work from a concrete example into the structure of the atom? Be great to see more examples.
LikeLike
Pingback: Beware, the superficial! – Memory, meaning and motivation